English


Feb 6, 2026
Shopkeeper Sales Comparison Tool
Attention all shopkeepers! Are you tired of obsessively and relentlessly tracking the growth rate of your business and profits?
You click back and forth between different views of data and different time periods to see how much you've grown.
Or you squeeze as much data as possible onto one screen.
Or you download CSV files to do your own, time-consuming analysis.
Shopkeeper says: no more! Our sales widgets now include a comparison feature as shown here:
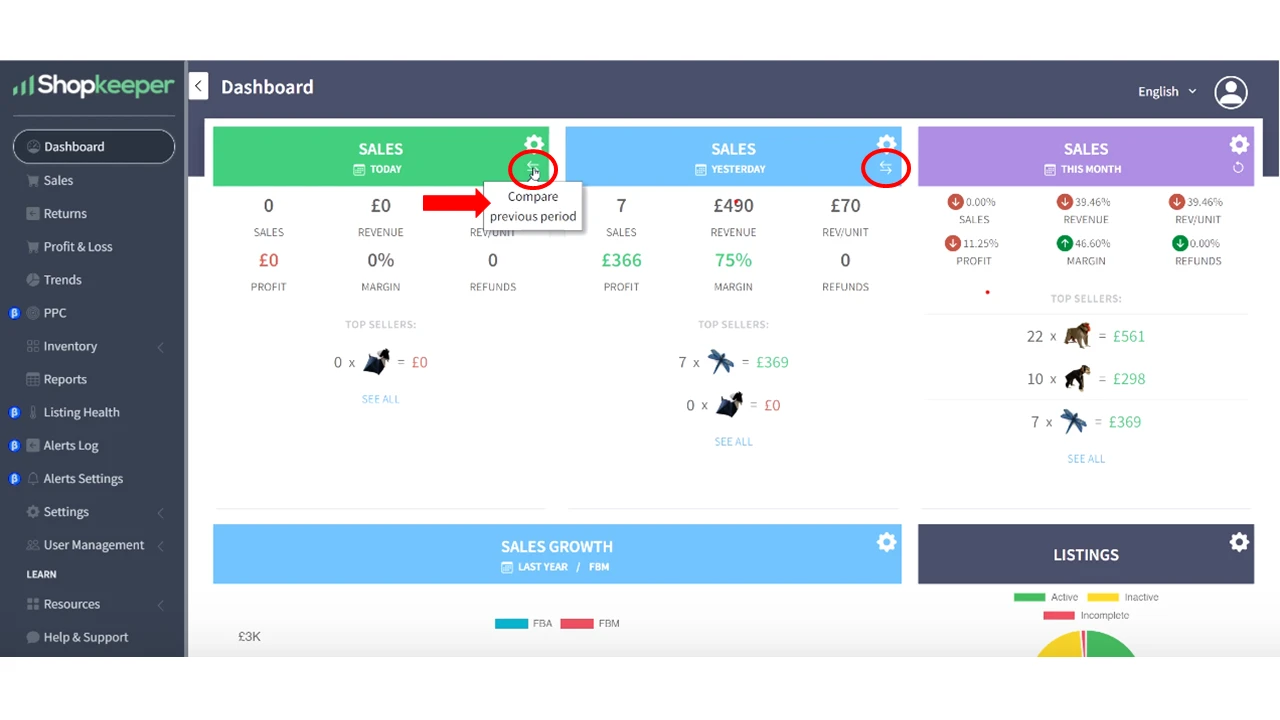
And with one simple click you can now compare your sales with the previous same period and you’ll see the percentage change in each metric.
For example, if you select yesterday for your sales widget, the button will compare yesterday to the day before yesterday.
If you select last month, it will compare it to the month before.
If you select a custom period, it will automatically compare it to the same period immediately before.
Let’s go through an actual example so you can see exactly how it works.
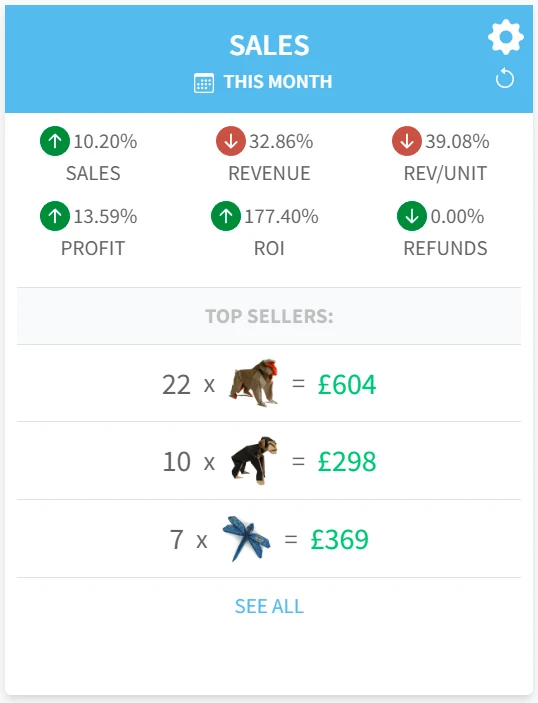
The percentage change in each metric is shown and green and red arrows help focus your attention. And by hovering over each arrow you can see the exact figures for both periods.
Let's face it, keeping track of sales metrics can be overwhelming, especially when you're trying to compare current sales with your historical data to assess how well your business is growing.
But with this new tool, the process has never been easier. You can now compare units sold, revenue, revenue/unit, profit, ROI, and refunds - all with the click of a button.
So, what are you waiting for? Go ahead and give it a try, and see how it can help you take your business to the next level!